Which week is statistically the best week to vacation in Brigantine Beach NJ?
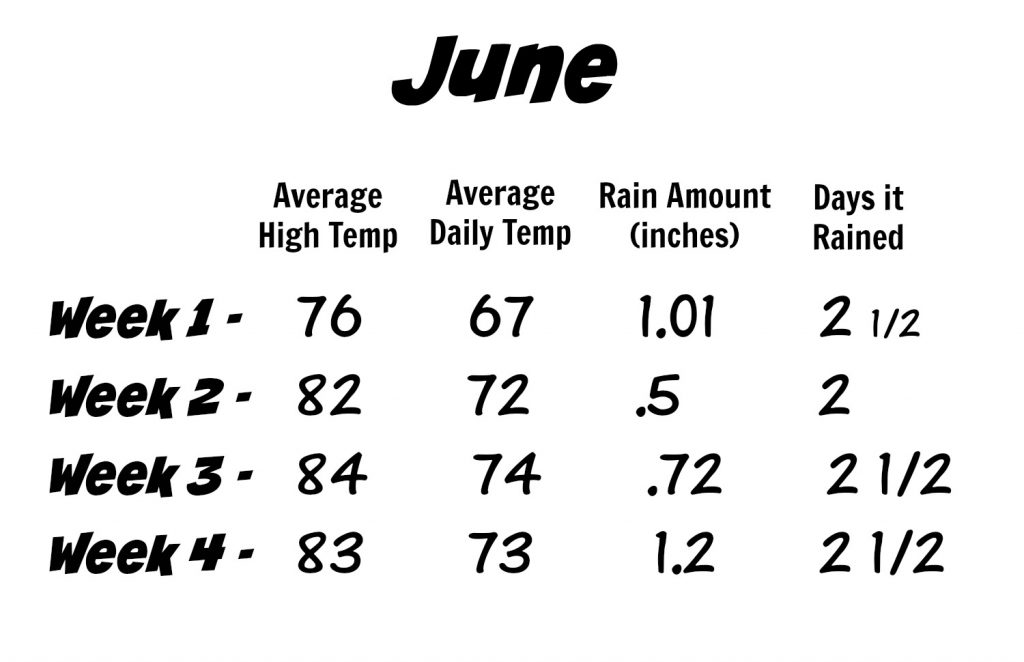
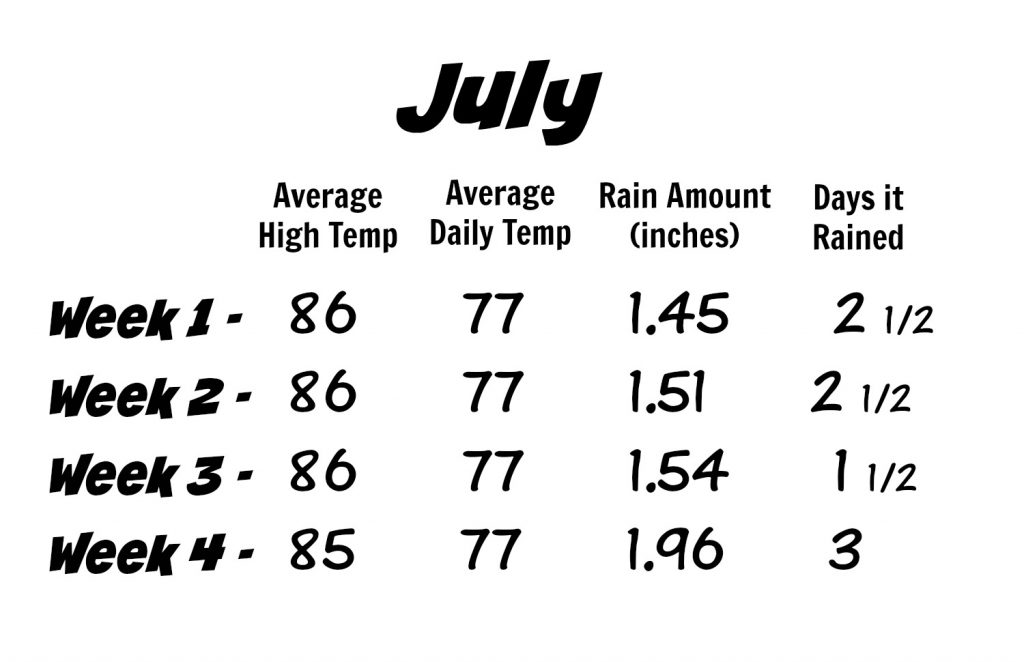
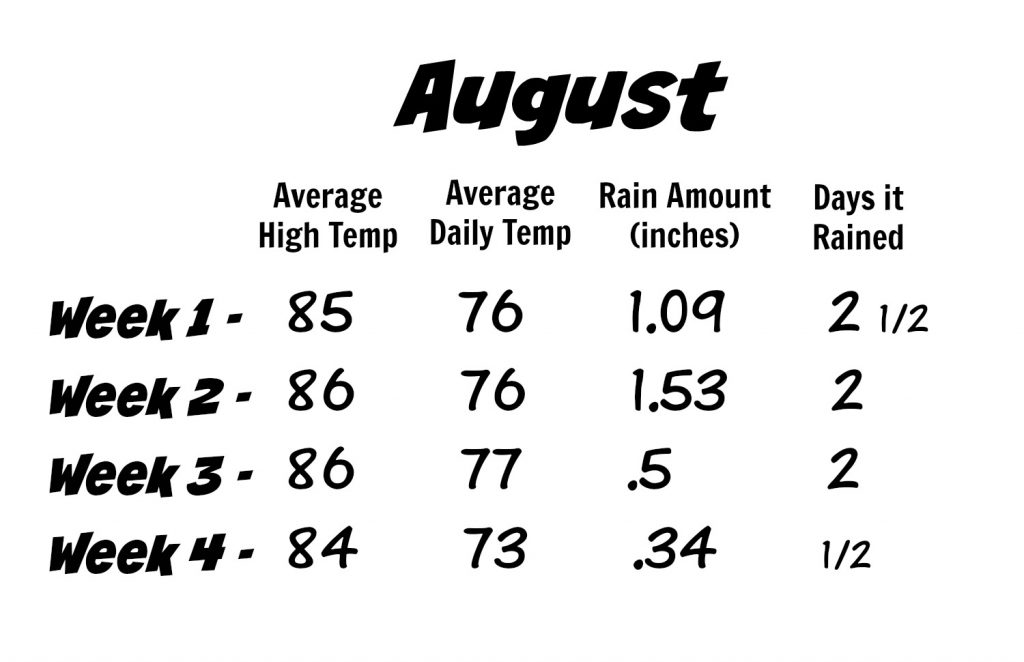
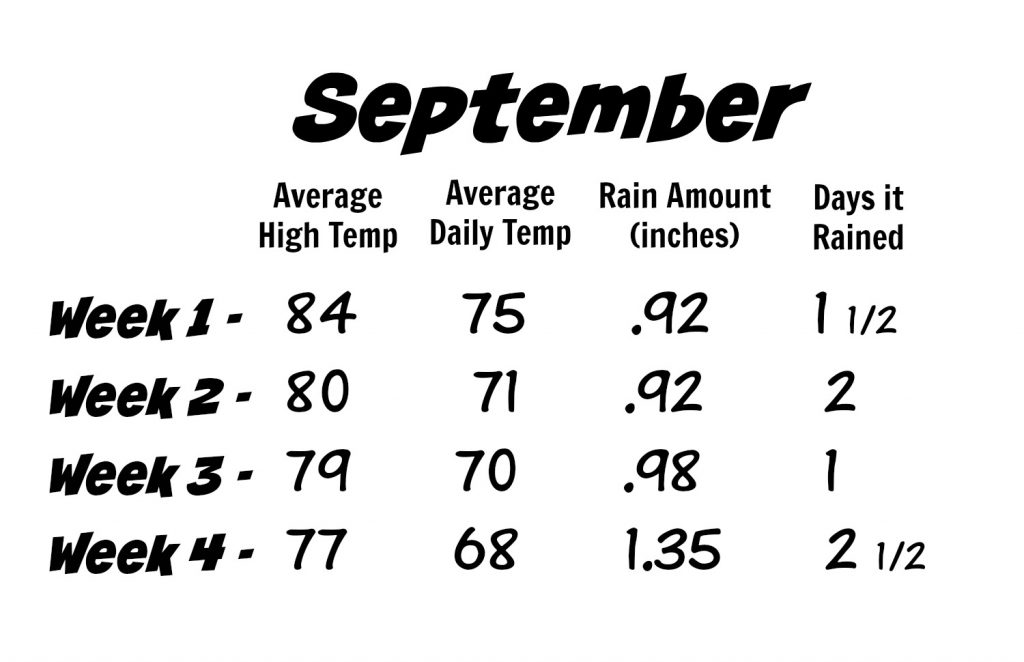
We did a 5 year history study on the weather conditions during the 12 prime weeks of summer in Brigantine. Data collected was the weekly average high temperature, average daily temperature, amount of precipitation that week and the number of days it rained. Here’s what we came up with ….
The wettest week statistically is the last week of July with an average of 1.96 inches of rain fall and three days of rain (rain could have fallen day or night). While this was the wettest week of the summer in Brigantine, the temps were still very comfortable with an average high of 85 degrees.
The best week to vacation in Brigantine? The last week of August. This came in as the driest week with just an average of .34 inches of rain and just a half day of rain over the entire week.
The average high temp came in at 84 degrees.
Average Ocean Temperature in Brigantine Beach NJ
June – 67 degrees
July – 74 degrees
August – 77 degrees
September – 72 degrees
How does your vacation week look?
Average weather in Brigantine Beach NJ from 2014 to 2018
Rain fall is based on a 24 hour period (could be day or night)


stats are from weather.org

